


In our Kubernetes consulting work, we get called into a lot of budget conversations that start the same way: the cloud bill jumped 30–40% after migrating to Kubernetes, and nobody can explain where the money's going. Finance wants answers, engineering pulls up AWS Cost Explorer, and all anyone sees are generic EC2 line items with no visibility into which services or teams are actually burning through resources.
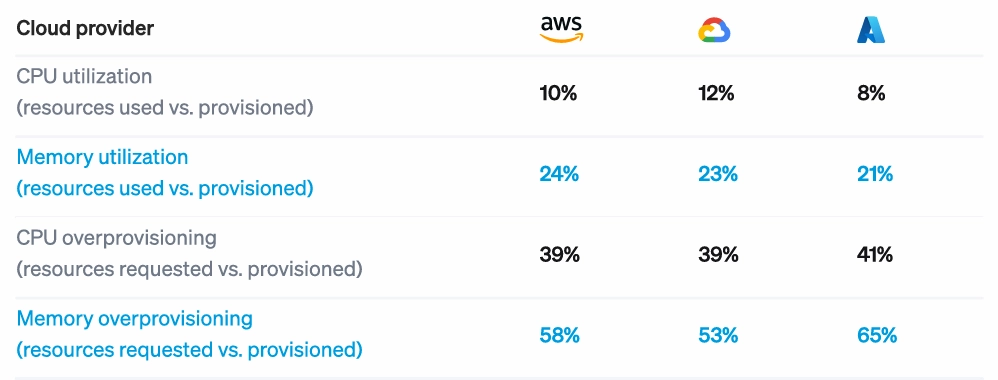
It’s not just our clients—the pattern is industry-wide. Cast AI's 2025 Kubernetes Cost Benchmark Report found that 99.94% of clusters are overprovisioned, with average CPU utilization at just 10%. If you've already tried the obvious best practices—enabled autoscaling, adjusted some resource limits, bought a monitoring tool—and costs keep climbing, you're hitting the same ceiling most companies hit.
This guide walks through the four-step approach we use to optimize Kubernetes costs, typically delivering 30–50% reductions within 60–90 days.
How to Fix Runaway Kubernetes Costs in Four Steps
The methodology follows a consistent sequence: gain visibility into where money actually goes, diagnose the specific causes of waste, prioritize fixes by ROI and risk, and implement through GitOps so they stick. Skipping ahead to implementation without proper diagnosis is how teams break production or watch costs creep back up within months.
Step 1: Get Visibility That’s Actually Actionable
A cost monitoring tool like AWS Cost Explorer tells you how much you spent on EC2 last month, not which namespace is responsible for 40% of that spend or which team deployed a service that’s been burning money since Q2.
The problem with tools like Cost Explorer is they stop at the infrastructure layer. Kubernetes cost management and optimization happens one level deeper at the workload.
Actionable visibility means attribution at multiple levels (cluster, namespace, deployment, pod) and understanding not just what you're spending, but what you're paying relative to what you're actually using. A service might account for $8,000/month in resource requests but only consume $2,000 worth of actual compute. That gap is where optimization opportunities hide.
Once you can actually see where money goes, you start to notice a few patterns:
- Resource requests vs. actual utilization per deployment: This is the core efficiency metric. If a deployment requests 2 CPU cores but consistently uses 0.4, that's an 80% waste rate on that resource.
- Idle node capacity: Nodes running at 30% utilization because bin-packing is inefficient or node pools are misconfigured.
- Orphaned resources: Deployments scaled to zero but nodes still running, persistent volumes attached to nothing, load balancers pointing at services that no longer exist.
- Single points of concentration: Often, one team or service is responsible for a disproportionate share of spend due to a single misconfiguration nobody caught.
We typically find that 40–60% of requested resources go unused across the clusters we assess. That matches industry benchmarks (Cast AI's research shows similar numbers), but seeing it in your own environment makes the optimization case much easier to make internally.
Step 2: Diagnose Why You’re Overspending
Visibility tells you where money goes. Diagnosis tells you why it's being wasted. These are different questions, and conflating them is how teams end up making changes that don't stick or that break things in production.
We generally find waste falls into four categories, each requiring a different fix.
Misconfigured Resource Requests and Limits
Developers set resource requests based on peak load estimates or the one time a pod got OOM-killed two years ago. The problem is that those numbers rarely get revisited. A service that needed 8GB of memory during a traffic spike 18 months ago might now peak at 2GB after code optimizations, but the request never changed.
We recently audited a cluster where a logging sidecar was requesting 2 CPU cores across 40 pods (80 cores total) while actual usage averaged 6 cores across the entire fleet. That single misconfiguration accounted for roughly $9K/month in waste.
How to diagnose it: Compare requested resources vs. actual consumption over 30 days. Look for consistent patterns. For instance, if a pod routinely uses 20% of its requested CPU, the request is probably 5x too high. Focus on deployments with the biggest absolute gap between request and utilization, since those represent the largest cost-saving opportunities.
Inefficient Node Pool Configuration
Generic node pools create resource fragmentation. If you're running all m5.xlarge instances but your workloads have diverse needs (CPU-heavy or memory-heavy), you end up with poor bin-packing. Nodes sit at 40% utilization because the remaining capacity doesn't match what pending pods need.
How to diagnose it: Look for nodes with high CPU but low memory utilization, or vice versa. Pod scheduling failures due to resource constraints, despite plenty of overall cluster capacity, are another signal. If the autoscaler keeps adding nodes but utilization stays low, your node types probably don't match your workload profile.
Underutilized Cloud Pricing Options
Running 100% on-demand instances when 60–70% of your workload is stable and predictable is one of the more expensive mistakes we see. The fix isn't technically complex, but it requires understanding your workload patterns well enough to commit.
How to diagnose it: Services that run 24/7 with consistent resource needs are candidates for Reserved Instances or Savings Plans. Find batch jobs, stateless services, or anything fault-tolerant that can handle interruptions—these can run on spot instances.
Process and Governance Gaps
Sometimes the waste isn't technical at all. Without resource quotas, teams have no reason to right-size their deployments, especially when the cost doesn't hit their budget. Without cleanup policies, dev and staging environments accumulate and get forgotten. And without visibility at the team level, nobody feels responsible for efficiency.
What to find and fix: Implement ResourceQuotas and LimitRanges at the namespace level to create natural constraints. Set up automated cleanup for idle dev/staging environments. Create cost showback reporting so teams can see their actual spend. These aren't elaborate fixes, but they prevent waste from reaccumulating after you've cleaned it up.
Step 3: Prioritize Fixes by ROI and Risk
Once you've diagnosed where waste is coming from, you'll probably have a list of 15–20 potential fixes. Prioritize based on impact and risk.
Quick Wins (High Impact, Low Risk)
One thing that surprises most teams is that right-sizing production services is usually lower risk than they assume. Engineers treat resource requests like load-bearing walls—touch them and everything collapses. But if a pod has been running at 20% of its requested CPU for six months straight, you have six months of evidence that the headroom isn't needed.
- Start with zombie resources. Look for deployments scaled to zero with nodes still running, orphaned persistent volumes, load balancers pointing at nothing, and namespaces for projects that ended six months ago.
- Right-size obviously overprovisioned deployments. If a pod is using less than 30% of its requested resources consistently over 30 days, you can reduce the request with high confidence.
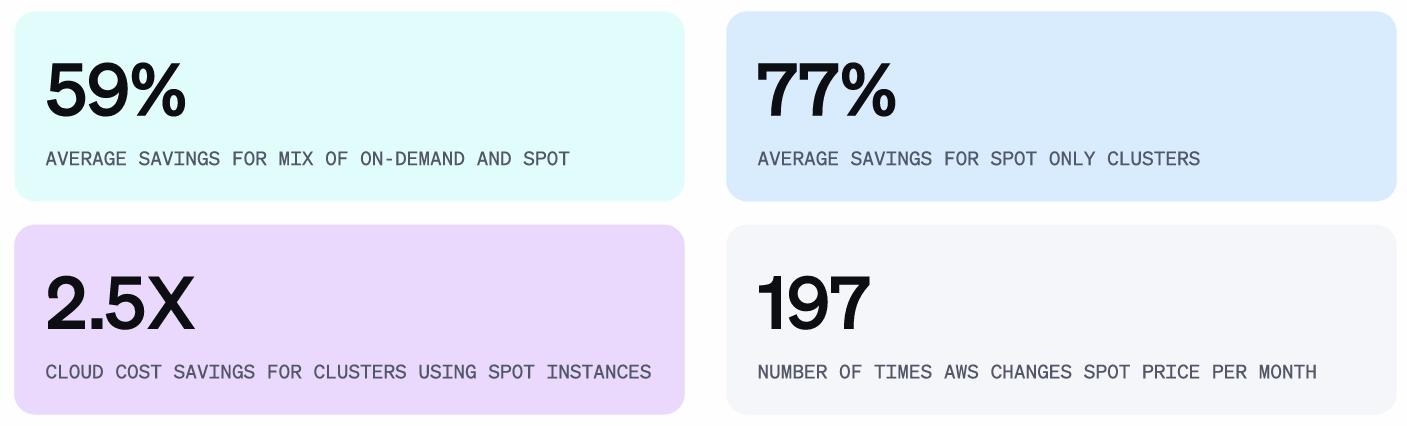
- Implement spot instances for batch jobs and non-critical workloads—low-risk, since these workloads can tolerate interruptions by design. Spot pricing typically runs 60–90% below on-demand, so even modest usage adds up.
Strategic Optimizations (High Impact, Medium Risk)
Comprehensive pod right-sizing across production services requires more careful implementation. Roll out changes gradually, monitor for OOM kills or performance degradation, and have rollback plans ready. Here are two factors to consider while you’re at it.
First, node pool reconfiguration and autoscaler tuning improve bin-packing efficiency and reduce idle capacity. This touches cluster infrastructure, so it needs proper testing and staged rollout.
Secondly, committing to savings plans or reserved instances locks in discounts for predictable baseline capacity. The risk here isn't technical—it's making the wrong commitment. You need confidence in your utilization forecasts before signing up for one- or three-year terms.
Specialized Optimizations (Medium Impact, Varies in Complexity)
Storage optimization, egress cost reduction, and multi-cluster efficiency tuning all matter, but they're usually not where the big wins are hiding. Design a structured approach that ensures consistency and addresses them after you've captured the larger opportunities.
For example, a typical 90-day timeline might look like this:
- Days 1–30: Visibility instrumentation plus quick wins. Expect around 20% cost reduction.
- Days 31–60: Strategic optimizations with careful rollout. Another 15% reduction.
- Days 61–90: GitOps implementation and governance setup to sustain the 35%+ total reduction long-term.
This is the common pattern we see. And while the exact numbers vary by environment, this sequence consistently outperforms the unstructured approach of implementing whatever optimization someone read about most recently.
Step 4: Implement Safely with GitOps
The optimization work doesn't stick if you implement it through manual kubectl commands and hope everyone remembers why those values were set. We've seen companies re-optimize the same cluster every six months because changes weren't codified anywhere. A new engineer joins, doesn't understand the rationale behind a resource limit, sets it higher "just to be safe," and the waste comes back.
GitOps solves this by treating your infrastructure configuration the same way you treat application code. Changes go through pull requests with a record of what changed and why, and configuration automatically reconciles if someone makes an out-of-band change.
At this stage, you need to pay attention to four key considerations for a successful implementation.
- First, ensure resource configurations, such as requests, limits, and autoscaling policies, belong in version-controlled manifests, not applied ad hoc through kubectl.
- Secondly, infrastructure settings like node pool configurations, instance types, and namespace quotas should live in Terraform or Pulumi. New namespaces automatically inherit sensible defaults, and changes have full audit trails.
- Thirdly, follow a standard progression to roll out changes safely. Even with good practices, changing resource configurations on production services carries risk.
Therefore:- Test in staging first. This seems obvious, but gets skipped more often than you'd think when teams are under pressure to cut costs quickly.
- Use canary deployments for production changes. Roll the new configuration to 10% of pods, monitor for problems, then expand to 50%, then 100%. Your deployment tooling (Argo CD, Flux, Spinnaker) should support this natively.
- Monitor the right signals during rollout. Latency percentiles, error rates, and OOM events are the key indicators. If P99 latency spikes or you start seeing OOMKilled pods, roll back immediately.
- Set up automated rollback triggers. If monitoring detects degradation beyond defined thresholds, the system should revert without waiting for a human to notice.
- Test in staging first. This seems obvious, but gets skipped more often than you'd think when teams are under pressure to cut costs quickly.
- Lastly, take actionable steps to prevent regression: For example, using LimitRanges at the namespace level enforces maximum resource requests. CI/CD pipeline checks can flag deployments that significantly increase projected costs. Policy engines like OPA Gatekeeper or Kyverno enforce organizational standards automatically.
Build cloud automation and optimization into your platform, not into policies that depend on engineers remembering to follow them.
What Results to Expect
The metrics that matter break into two categories, and you need both. Cost reduction that degrades reliability is corner-cutting that will eventually catch up with you.
Financial Metrics:
- Absolute cost reduction is the headline number—how much your monthly cloud bill dropped in real dollars. But it's not the only financial metric worth tracking.
- Cost per unit of business value tells you whether efficiency is actually improving. This might be cost per transaction, cost per active user, or cost per API call, depending on your business model. Your bill might stay flat while traffic doubles, which is actually a 50% efficiency gain.
- Requested vs. actual spend ratio measures how much of what you're paying for is actually being used. If you're requesting $100K in resources monthly but consuming $40K, you've got a 60% waste rate. This number should tighten over time as right-sizing takes hold.
- Savings plan and reserved instance coverage tracks how much of your predictable baseline is locked in at discounted rates versus running at on-demand pricing.
Operational Metrics:
- Resource utilization should climb from the typical 10–25% range up toward 60–80%. Going higher than that leaves too little headroom for traffic spikes.
- OOM kills and pod eviction frequency must stay flat or decrease. If these spike after optimization, you've cut too deep and need to back off.
- Application latency and error rates are the ultimate check. P95 latency shouldn't degrade, and error rates shouldn't climb. If they do, the optimization isn't working—it's just breaking things slowly.
- Scheduling failures indicate whether your cluster can actually place pods where they need to go. A spike here after node pool changes means your bin-packing assumptions were wrong.
How UKi Cut $500K in Annual Cloud Costs with Kubernetes Optimization
Ultimate Knowledge Institute (UKi), a cybersecurity training company serving Fortune 500 companies and federal agencies, came to Pelotech with infrastructure costs scaling faster than revenue. Their training platform depended on an expensive third-party virtualization provider that caused hundreds of work stoppages and wasn't built for the scale they needed.
Pelotech rebuilt UKi’s virtualization platform on Kubernetes using KubeVirt for VM workloads, Kube-OVN for software-defined networking, and auto-scaling bare metal nodes to run VMs on demand.
The engagement eliminated 100% of UKi's third-party dependencies, saving $500K annually. Manual work dropped by 50%, and deployment time fell by 97%. UKi's co-founder had estimated they were three years away from owning their virtualization platform, but Pelotech delivered a working proof of concept in 2.5 months.
DIY vs. Cost Optimization Expert Partners: When Each Makes Sense
DIY optimization works when you have dedicated platform engineers with deep Kubernetes expertise and time to learn through trial and error. If your clusters are relatively simple (single team, straightforward workloads), this guide can get you most of the way there.
Expert partners make sense when:
- You've hit a ceiling. Obvious fixes are done, but costs are still too high. You bought monitoring tools but aren't sure how to prioritize what they're showing you.
- Speed matters. Finance wants immediate reductions, and your team should be building product, not learning Kubernetes cost optimization through trial and error.
- Complexity exceeds internal expertise. Multi-cluster environments, multi-cloud architectures, and regulatory requirements like GovCloud or FedRAMP.
- You want sustainable results, not a one-time fix. You need GitOps implementation, governance frameworks, and a partner who builds internal capability while delivering immediate savings.
The build vs. buy calculus is simple. Compare the cost of delayed optimization against the cost of bringing in help. For clusters spending $50K+ monthly with significant overprovisioning, the math usually favors capturing savings immediately.
Make Kubernetes Spend Predictable and Intentional
Unchecked Kubernetes costs erode trust in cloud-native strategies entirely. We've seen leadership teams start questioning whether the Kubernetes migration was worth it—not because the technology failed, but because nobody built the cost discipline to match the operational flexibility.
The path forward is the same whether you do it yourself or bring in help. Get real visibility into where money goes. Diagnose your specific waste patterns instead of applying generic advice. Prioritize fixes by actual ROI. Implement through GitOps so the work compounds instead of decaying.