

.webp)
It started with a reasonable question from a client:
“Why is this specific action slower in our test environment than in production? Test has way less traffic — shouldn’t it be faster?”
Lower traffic should mean less load, which should mean faster responses. In serverless architectures, that intuition can be misleading and can lead to wasted time figuring out why . Fortunately we figured it out in minutes, because we had the data we needed in a form we could actively explore.
That gap is where most serverless performance work actually lives. This article is about what’s happening underneath, why AWS Lambda cold starts get blamed for problems they didn’t cause, and when they genuinely are the bottleneck worth solving.
What Happens During an AWS Lambda Cold Start?
The term “cold start” collapses three distinct phases into one blob, which is part of why teams struggle to debug it. The Lambda execution lifecycle has three stages: INIT, INVOKE, and SHUTDOWN. The cold start is the INIT phase, and it has its own substructure.
The three components of INIT

- Execution environment provisioning. AWS allocates a Firecracker microVM, attaches the runtime image, and mounts your code from S3 (or pulls from ECR for container packaging). Container images add a few hundred milliseconds over ZIP archives.
- Runtime initialization. The language runtime boots. Runtime choice dominates this phase.
- Init code execution. Everything above your handler runs here, including SDK client instantiation, database connection setup, config fetches, and dependency loading. This is the phase you actually control, and where most avoidable latency lives.
The August 2025 INIT billing change
One detail worth knowing: as of August 1, 2025, AWS bills the INIT phase for all Lambda functions, including ZIP-packaged managed runtimes that were previously free during initialization. This standardized how INIT is billed across configurations.
For most workloads, the billing impact is modest, but there are exceptions:
- Java or .NET functions without SnapStart
- Low-traffic workloads where the cold-start-to-invocation ratio is high
- Functions with heavy init code (ML model loading, framework bootstrapping)
Monthly cost increases of 10–50% have been reported for these cases.
Why Low-Traffic Environments Suffer More
Back to the original client question: test was slower than production despite lower traffic.
In production, Lambda invocations are frequent enough that AWS keeps execution environments warm. A request arrives, there’s already a running environment, and the INIT phase is skipped entirely. In a test environment, requests arrive minutes or hours apart. AWS reaps idle environments - community benchmarks put this around 7–45 minutes depending on memory allocation, so each test invocation is more likely to be cold.
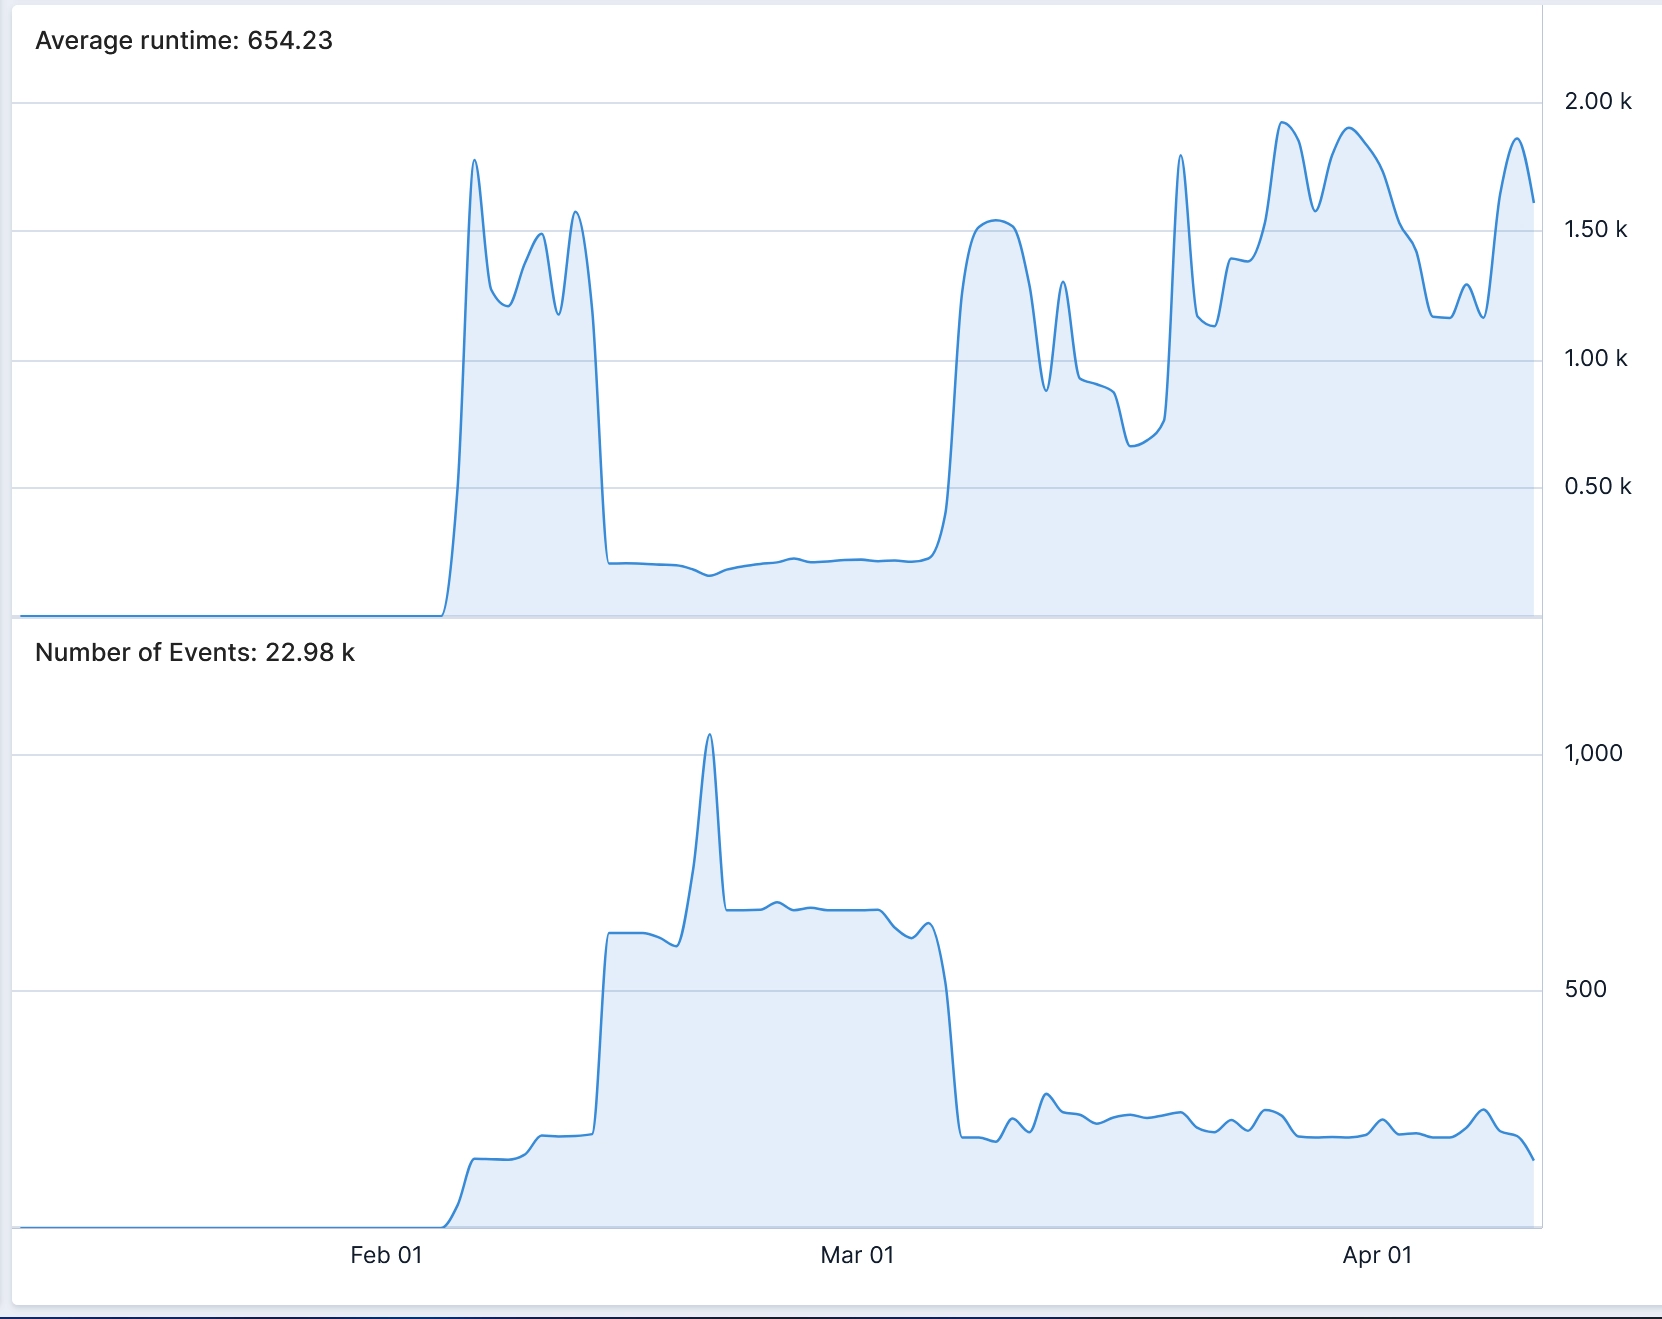
The counterintuitive consequence: lower traffic produces higher average latency. When we graphed average duration against invocations per minute on the same time axis, the inverse correlation was immediate: traffic up, runtime down; traffic down, runtime spikes. Cold start cost made visible.
This also explains why test and prod often diverge even when the code is identical. If production uses provisioned concurrency (keeping instances warm) and test uses on-demand, you’re comparing two different execution models and then being surprised they perform differently.
The Diagnostic Question Teams Skip
Before reaching for any cold-start fix, it’s important to note that it’s actually pretty easy to misinterpret certain symptoms as a cold start. Here's how to tell them apart:
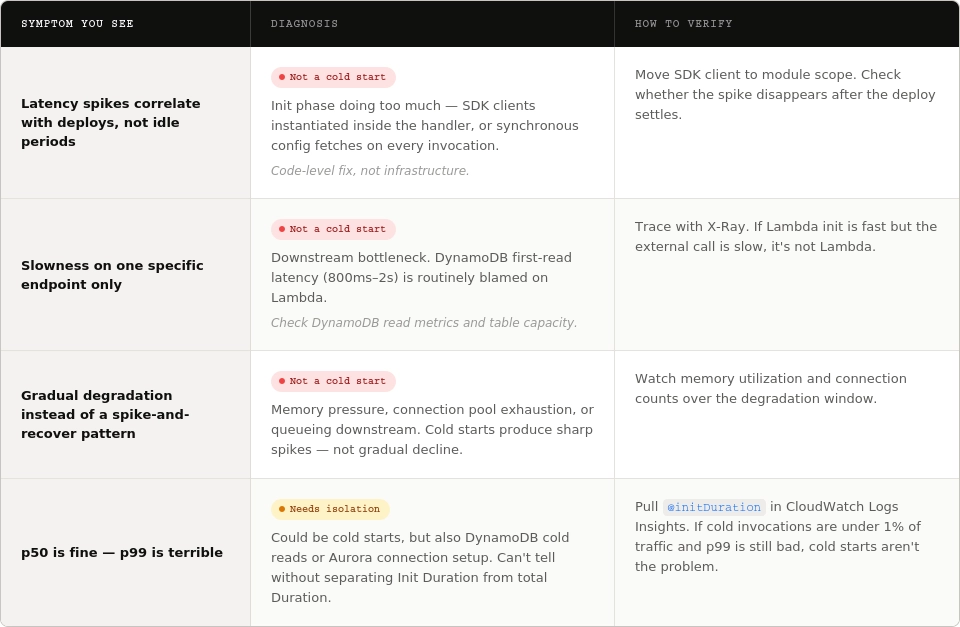
You can verify your findings by pulling @initDuration in CloudWatch Logs Insights (present only on cold invocations) and comparing the cold invocation rate against your latency distribution. If cold invocations are under 1% of traffic and p99 is still bad, cold starts aren’t your problem.
Seeing It in Your Own Data
CloudWatch gives you Duration, Invocations, and Errors out of the box. What it doesn’t give you by default is a clean view of cold start rate over time, or the correlation between invocation frequency and average latency.
A starting query in CloudWatch Logs Insights:
filter @type = "REPORT"
| stats count() as invocations,
        count(@initDuration) as coldStarts,
        avg(@duration) as avgDuration,
        avg(@initDuration) as avgInitDuration
  by bin(5m)
This gives you the cold start rate and average INIT duration per 5-minute bucket. Graph it against invocation count and the pattern from the opening story emerges immediately.
The deeper capability isn’t running one prebuilt query; it’s being able to take a vague hunch (“test feels slow, maybe cold starts?”) and get to a visual answer fast enough that exploration stays cheap. That’s what operational visibility actually buys you: faster answers to the questions that matter.
How to Reduce AWS Lambda Cold Starts
Once you’ve confirmed cold starts are the dominant cause, the fixes are split by cost, complexity, and where the bottleneck lives in the INIT phase.
1. Implement Code-level changes (free, highest ROI)
These solve the init-phase portion, which is usually the largest component you can actually influence.
- Keep handler setup minimal. Any code outside the handler runs on every cold start. Move non-essential setup inside, or gate it behind first-use checks.
- Lazy-load heavy dependencies. In Node, use await import('...') inside the handler so large libraries only load when actually used. Python supports the same pattern with function-scoped imports.
- Cache SDK clients and connections outside the handler. Instantiating a new DynamoDB client per invocation is one of the most common unforced errors. Declare clients once at module scope; warm invocations reuse them.
- Tree-shake and bundle aggressively. Use esbuild or Webpack with dead-code elimination. For Node, import individual AWS SDK v3 clients (@aws-sdk/client-dynamodb) rather than the whole SDK.
- Trim AWS SDK credential providers. The default credential chain pulls in SSO, INI, ECS, and environment providers. If you’re running in Lambda you only need the env provider. Explicit removal can save 50–100 ms on Node cold starts.
- Reduce deployment package size. Benchmarks consistently show package size as one of the highest-impact variables. Aim for sub-1MB for Node where feasible.
2. Make Configuration changes
- Increase memory allocation. Lambda scales CPU proportionally with memory, so a function that’s CPU-bound during init will benefit even if it never uses the extra RAM. AWS Lambda Power Tuning finds the inflection point.
- Move from x86 to ARM64 (Graviton). Published benchmarks show 13–24% faster initialization at roughly 20% lower cost per ms.
- Upgrade to newer managed runtimes. Node 20 and 22 have measurable init improvements over 18. Python 3.12+ is required for SnapStart. Older runtimes also eventually hit deprecation.
- Skip VPC attachment when possible. Post-Hyperplane (2019), VPC overhead is typically under 100 ms, but if your Lambda doesn’t need private VPC resources, don’t attach it. RDS Proxy, public DynamoDB endpoints, and internet-accessible services are all faster paths.
3. Use AWS-native features
Two features target the cold start directly. They solve different problems and are mutually exclusive on the same function.
4. Measure before and after
You might think you’ve “optimized” cold starts, but how would you know that it even worked? Here’s what you can do: .
- Build a baseline. A minimal hello-world Lambda with your same memory, runtime, and architecture tells you the floor. If your real function’s init is 2 s and the baseline is 300 ms, 1.7 s of that is your code.
- Use X-Ray for bottleneck isolation. X-Ray traces show where init time is actually spent; ie. runtime bootstrap,. SDK client creation, or first external call.
- Track Init Duration over time, not just average duration. Most teams watch p50/p99 duration. Watch init duration separately; otherwise you’ll never see which optimizations moved the needle.
5. Identify when to stop optimizing and change architecture
If cold starts still dominate your latency budget after code changes, SnapStart, and provisioned concurrency, the honest answer may be that Lambda isn’t the right primitive for this workload. Alternatives:
- ECS Fargate or App Runner for warm-by-default containers without managed infrastructure
- Containers on EKS where Kubernetes is already in the stack
- Step Functions for workflows that would otherwise pay Lambda init on every step
This is a bigger conversation, but it’s worth having. The best fix to a cold start is sometimes not being on Lambda.
Recap
Cold starts aren’t a hard problem. Knowing whether they’re your problem is.
Most customers we work with have spent weeks on cold-start optimization when the actual bottleneck was two services downstream.
The faster you can get from question to visualization, the faster your team stops firefighting and starts understanding.